Weekly Austin Real Estate Market Update

Austin Real Estate Weekly Market Update - June 05, 2025

by: Dan Price, Broker at Team Price Real Estate
Austin's leading data analysis brokerage, where data drives exceptional service

Published on: Thursday, June 05, 2025 at 5:33 am

Austin’s Real Estate Market : Stay ahead in Austin’s real estate market with the latest data from Team Price Real Estate. As of this week, active listings across the Austin-Area MLS have risen to 17,168—up 6.1% from a year ago—while Months of Inventory now stands at 6.25, a 17.5% increase that reflects a growing supply and slower pace of home sales. Median sold prices continue to adjust, now down 2.3% year over year to $430,000. These trends point to a shifting market that favors buyers in many segments. For a full, in-depth view of what’s happening across the region, download our comprehensive market update—featuring over 800 pages of up-to-date Austin housing data. 

Image Display
Image

Austin Real Estate Market Overview

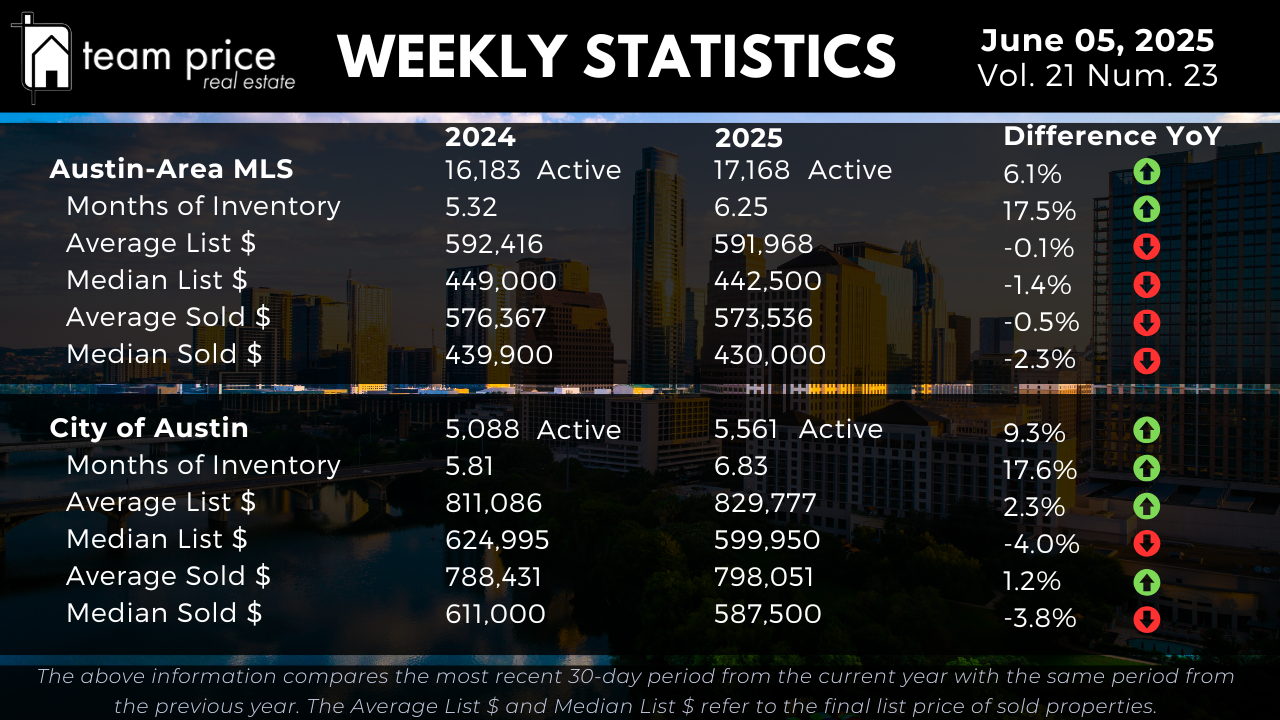
Inventory across the Austin-Area MLS continues to build. As of this week, there are 17,168 active residential listings—up 6.1% from the same time last year. Months of Inventory has climbed from 5.32 to 6.25, a 17.5% increase that reflects both steady listing activity and a deceleration in absorption. In practical terms, the market now has over six months of supply, signaling a shift toward more balanced conditions. Within the City of Austin, the expansion is even more pronounced, with active listings up 9.3% year over year to 5,561. Months of Inventory now sits at 6.83, a 17.6% increase and a clear indicator that the city is adjusting to slower turnover. This trend confirms that the Austin market remains in the midst of a methodical correction rather than a crash, offering buyers increased negotiating power and time.

Austin Housing Prices: Gradual Pressure Builds

Price movement in the Austin-area MLS continues to reflect softness across much of the market. The average list price has held relatively flat year over year, declining by just 0.1% to $591,968. Average sold prices have dipped slightly, down 0.5% to $573,536. More revealing are the median figures: the median list price is down 1.4% to $442,500, while the median sold price is now $430,000—a 2.3% annual decline.

In the City of Austin, the numbers tell a mixed story. While the average active list price has increased 2.3% to $829,777—buoyed by higher-end offerings—the median list price has declined 4.0%, down to $599,950. This discrepancy between average and median values highlights underlying weakness in mid-range price points. The average sold price is up 1.2% year over year to $798,051, yet the median sold price has fallen 3.8% to $587,500. These figures suggest ongoing market segmentation: well-positioned, move-in ready homes continue to sell, while others face increasing price resistance.

Regional Trends: Price Gains Uneven Across Central Texas

When analyzing the broader Central Texas region, pricing shifts continue to vary city by city. Of the 30 cities tracked, 53% experienced month-over-month price gains, while 43% recorded declines. However, on a year-over-year basis, only 11 cities (37%) saw price increases, with the remaining 63% posting annual declines. Importantly, none of the cities are currently priced above their 12-month peak—all 30 remain below.

At the ZIP code level, patterns are similarly mixed. Out of 75 ZIP codes, 38 (51%) saw month-over-month appreciation, while 37 (49%) declined. Compared to last year, only 27 ZIP codes (36%) have higher prices, while 48 (64%) have declined. Just one ZIP code remains above its 12-month high, reinforcing that the price corrections observed in Austin are part of a widespread regional reset—especially in submarkets that overextended during the 2020–2022 appreciation cycle.

List-to-Sale Price Performance: Modest Negotiation Continues

As of early June 2025, 62.96% of all homes sold below the list price—virtually unchanged from last month’s 62.98%. Roughly 22.06% sold at the asking price, while 14.98% sold over list—down from 16.81% in May of last year. The average sold-to-list price ratio currently stands at 97.74%, indicating that while sellers are still achieving strong final prices, buyer leverage is clearly more present than during previous spring markets. Well-priced homes continue to draw multiple offers, but aggressive pricing without alignment to current comparables often leads to price reductions or extended market time.

Peak Value Trends: Still Well Below the Top

Austin remains notably below its pricing peak. In the Austin-area MLS, the average list price peaked at $723,301 in April 2025 and now stands at $690,357—down 4.6%. The median list price has dropped 10.2% from its May 2022 peak of $539,900 to $485,000. Average sold prices are down 12.8% from $664,515 to $579,204, and the median sold price has fallen a sharper 19.1%, from $538,000 to $435,000. Average price per square foot is now $258, a 20.3% decline from its high of $324, while the median is down 21.8%, from $280 to $219.

In the City of Austin, the average list price peaked at $960,136 and has since declined 6.9% to $893,033. The median list price has dropped 11.1%, from $674,999 to $599,900. On the sales side, the average sold price is down 5.5% from its peak, while the median sold price has fallen 12.5%, from $680,000 to $595,000. Price per square foot metrics mirror this trend: the average has declined 19.0%, from $442 to $358, and the median is down 19.8%, from $393 to $315.​

Austin Area Residential Sales Insights

Austin Real Estate FAQ : June 5th 2025

1. Is the Austin housing market in a downturn or just correcting?

The Austin housing market is currently in a measured correction, not a collapse. Inventory has expanded 6.1% year-over-year, rising from 16,183 to 17,168 active listings. Months of Inventory increased 17.5%—from 5.32 to 6.25 months—signaling a slowdown in absorption and a more balanced playing field between buyers and sellers. In the City of Austin, this trend is even more pronounced, with inventory up 9.3% and Months of Inventory climbing from 5.81 to 6.83. These levels are consistent with historical market normalization and reflect a transition away from the overheated conditions of 2021–2022. The correction is being driven by higher sustained inventory and increased days on market, not a collapse in demand. There’s no evidence of distressed selling; rather, sellers are adjusting pricing expectations as buyers become more price sensitive.

2. How have home prices changed in Austin over the past year?

Prices across the Austin-area MLS have softened slightly but remain well above pre-pandemic levels. The average list price is virtually unchanged, down just 0.1% from $592,416 to $591,968. The average sold price declined by 0.5%, from $576,367 to $573,536. However, the median figures tell a clearer story of price pressure: the median active list price fell 1.4% to $442,500, and the median sold price dropped 2.3% to $430,000. Within the City of Austin, the average sold price actually increased 1.2%, from $788,431 to $798,051, suggesting that higher-end transactions are holding up. Still, the median sold price declined 3.8%, from $611,000 to $587,500, highlighting weakness in the mid-range. Overall, price trends indicate that while the market isn’t crashing, values are adjusting—especially in areas or price segments that overheated during the pandemic.

3. What is the current state of inventory in the Austin housing market?

Inventory levels are climbing across both the region and the city, creating a more favorable environment for buyers. The Austin-area MLS has 17,168 active listings—up from 16,183 one year ago. This 6.1% increase is significant, but what’s more telling is the Months of Inventory figure, which now stands at 6.25. That’s a 1.2x increase from last year, suggesting a slowdown in buyer activity relative to the volume of new listings. In the City of Austin, inventory grew even faster—up 9.3% to 5,561 listings, with Months of Inventory rising to 6.83. These levels mark a return to balanced market conditions where neither buyers nor sellers have a strong advantage. For the first time in several years, buyers are seeing more choices and longer decision windows without the pressure of extreme competition.

4. Are homes in Austin selling below, at, or above list price?

The majority of homes in the Austin-area MLS are now selling below list price. In early June 2025, 62.96% of homes sold under their list price, a figure nearly unchanged from the previous month. Meanwhile, 22.06% of homes sold at list price, and just 14.98% sold above asking. This is down from 16.81% a year ago. The average sold-to-list price ratio currently stands at 97.74%. This means sellers are typically conceding about 2.25% off list price during negotiations. These figures reflect a more rational market—overbidding is less common, and buyers are exercising more caution. However, well-priced, turnkey homes can still command strong offers, particularly in desirable school zones or walkable neighborhoods. Strategic pricing and presentation are now more critical than ever for sellers.

5. How does the current market affect buyers and sellers in Austin?

For buyers, the June 2025 market offers more selection, time to make decisions, and increasing opportunities for negotiation. With inventory up and prices slightly down—particularly in the median range—affordability is improving modestly. The chance of bidding wars is lower, and the data shows most homes are selling below asking. That said, the most attractive homes are still moving quickly and often close to list price.

For sellers, it’s a more competitive environment. While average prices haven’t dropped dramatically, sellers must align their pricing strategy with current comps and market realities. Homes priced based on 2022 expectations are sitting longer and attracting below-list offers. The market rewards accuracy and presentation—staging, condition, and photography all matter. With the market in correction, sellers should plan for longer timelines and avoid overpricing.​